

We were confident that this would eventually place pressure on households, which would lead to weakness in consumer spending. The questions that arose then were (1) when would this occur, and (2) how would it unfold?
At around 50% of GDP, the fate of consumer spending has relevance well beyond just the listed consumer stocks. In this article, we discuss some of the issues that we’re considering while building our forecasts for the consumer sector and the broader economy.
Headline inflation of ~5-6% understates the true cost of living pressure many households are currently facing. Aside from sharply higher mortgage costs, utilities and insurance are both increasing at well over 10% p.a. Rental inflation is also accelerating and many grocery items are also increasing at high single digit rates.
Household savings buffers are wearing, so households are likely to cut spending
The aggregate estimate for excess household savings is currently around $300 billion. There is a view held by some that the increases in cost of living can be largely offset by a fall in the rate of savings back to pre-COVID levels (from ~$120 billion p.a. through the pandemic to ~$60 billion p.a.).
While this may be true at an aggregate level, it’s what happens at the margins that matters. A recent UBS survey suggested that more than half of low-income earners will run through cash buffers in the next two to three months, with just over a third of middle-income earners and around a quarter of high-income earners in the same position[1].
RBA analysis estimated the share of owner occupier households with a variable rate mortgage facing negative cash flow would be roughly 15% (assuming they made no changes to spending)[2]. This, however, assumes a 3.75% cash rate, so it’s likely understating the figure. In response to the tighter cashflows, the UBS survey also found that around 28% of households said they would reduce spending moderately, and 22% significantly. It’s no surprise that when splitting this by income demographic, almost half of households with income between $48,000-120,000 will adjust spending significantly. This is a key demographic for mass market retailers.
Variable interest rate lag
It takes around two to three months for banks to fully pass on increases in the RBA cash rate. It then takes, on average, a further two months for households on a variable rate mortgage to reduce spending.
Given this lag (which is possibly longer in this cycle due to the elevated level of household savings), and the discounting from the banks, we suspect that analysts are assuming more of the variable rate impact is already reflected in consumer spending than is actually the case.
The fixed rate mortgage cliff
Coming out of COVID, around 45% of Australian mortgages were fixed compared to 10-15% historically. For fixed rate mortgages taken out during COVID, the average borrowing rate was roughly 2.25%, but at expiry, will reset to 6%+. These mortgage resets are occurring now, and the impact on consumer spending is expected to be felt through the second half of this year.
Economists are currently forecasting a terminal cash rate of around 4.5%, which would suggest a peak mortgage rate of just under 7%. The chart below shows that while the RBA rate hikes are coming to an end, we estimate the weighted average mortgage rate for households is currently only around 4.9% versus the standard variable rate around 6.5%.
The above numbers suggest that households have currently absorbed around 2.4% of rate hikes (i.e. the current weighted average mortgage rate of 4.9% less the 2.5% average before RBA hikes started in May 2022). This means that households have a further ~2% in rate hikes to be absorbed and reflected in consumer behaviour. The reaction of households to higher rates is not linear, with consumers adjusting spending at a faster pace the higher rates go. It is therefore possible that we may not even be halfway through the slowdown in consumer spending.
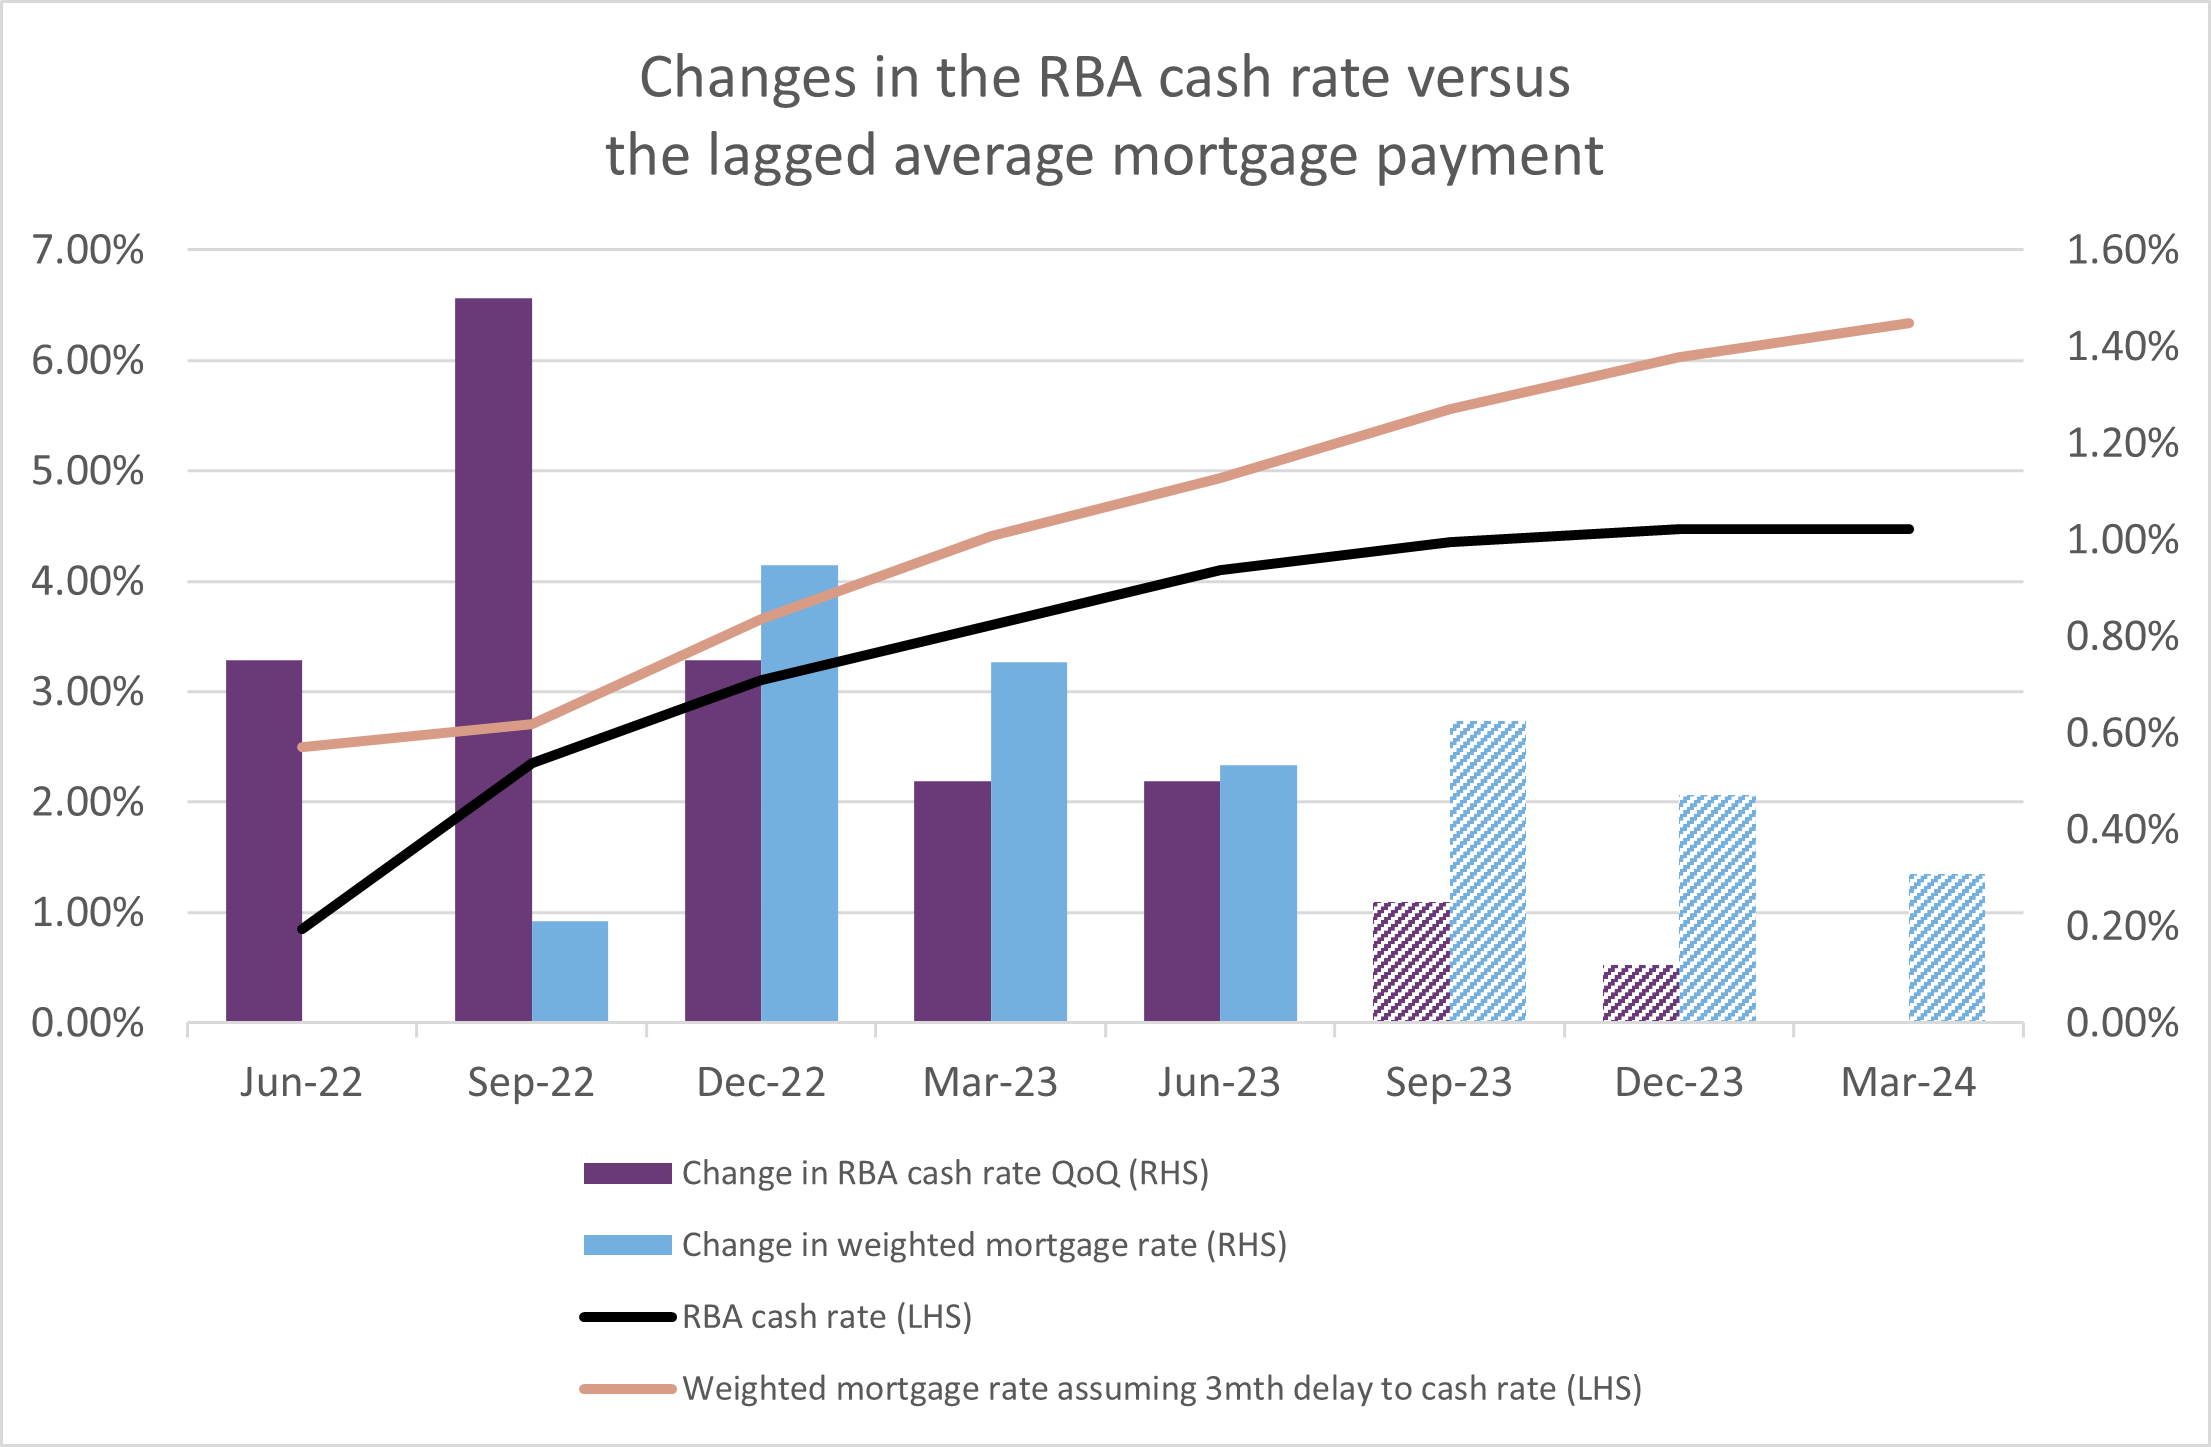
Source: Touchstone Asset Management, Reserve Bank of Australia. Forecasts are derived from the Australian cash rate futures curve.
Low and middle income tax offset (LMITO)
In addition to the impact from higher interest rates, we believe the market is missing the upcoming impact in the third quarter of this year from cycling the LMITO. This provided around an $11 billion benefit to consumers (via $1,500 tax refunds) who had a high propensity to spend. We suspect that the bulk of the spending occurred in the second half of 2022.
Is the 2010-2012 downturn a useful reference point for the end of the LMITO?
In February 2009, the government announced the $42 billion Nation Building and Jobs Plan. This included a number of direct payments to households, which commenced around April 2009. The impact on consumer spending and company earnings was seen through late FY09 and early FY10. By early FY11, some analysts had worked out the retailers were cycling unsustainably strong numbers and, therefore, growth would slow. Stocks started trading sideways. However, it wasn’t until April-May 2011 when the reset really began, and stocks then fell until early 2012.
For example, JB Hi-Fi (JBH) peaked in September 2010 at just over $22, and fell to below $8 by June 2012, generating a total loss of around 60%.
Electrical was the toughest category in retail, with competitors going bust and liquidating stock. Harvey Norman (HVN) had a total return of around -44% in this time. The department stores were similarly under pressure, with Myer (MYR) and David Jones (DJS) generating losses of -43% and -50% respectively.
What’s notable, however, is that higher quality staples were unscathed. Woolworths finished 2011 in line with the ASX200 return, and by June 2012 had outperformed by 6%. Super Retail (SUL) was the star due to strong trading in its auto and leisure business, and because it used industry weakness to acquire Rebel Sport.
This explains why we continue to favour Wesfarmers (WES) in the sector – its Bunnings business has displayed solid earnings through past cycles, with the broader WES group able to opportunistically acquire or expand market share during economic downturns.
A final point to note is that JBH had a number of 10-25% rallies during its larger 60% bear market. Staying positioned through a decline with that sort of volatility is exceptionally difficult.
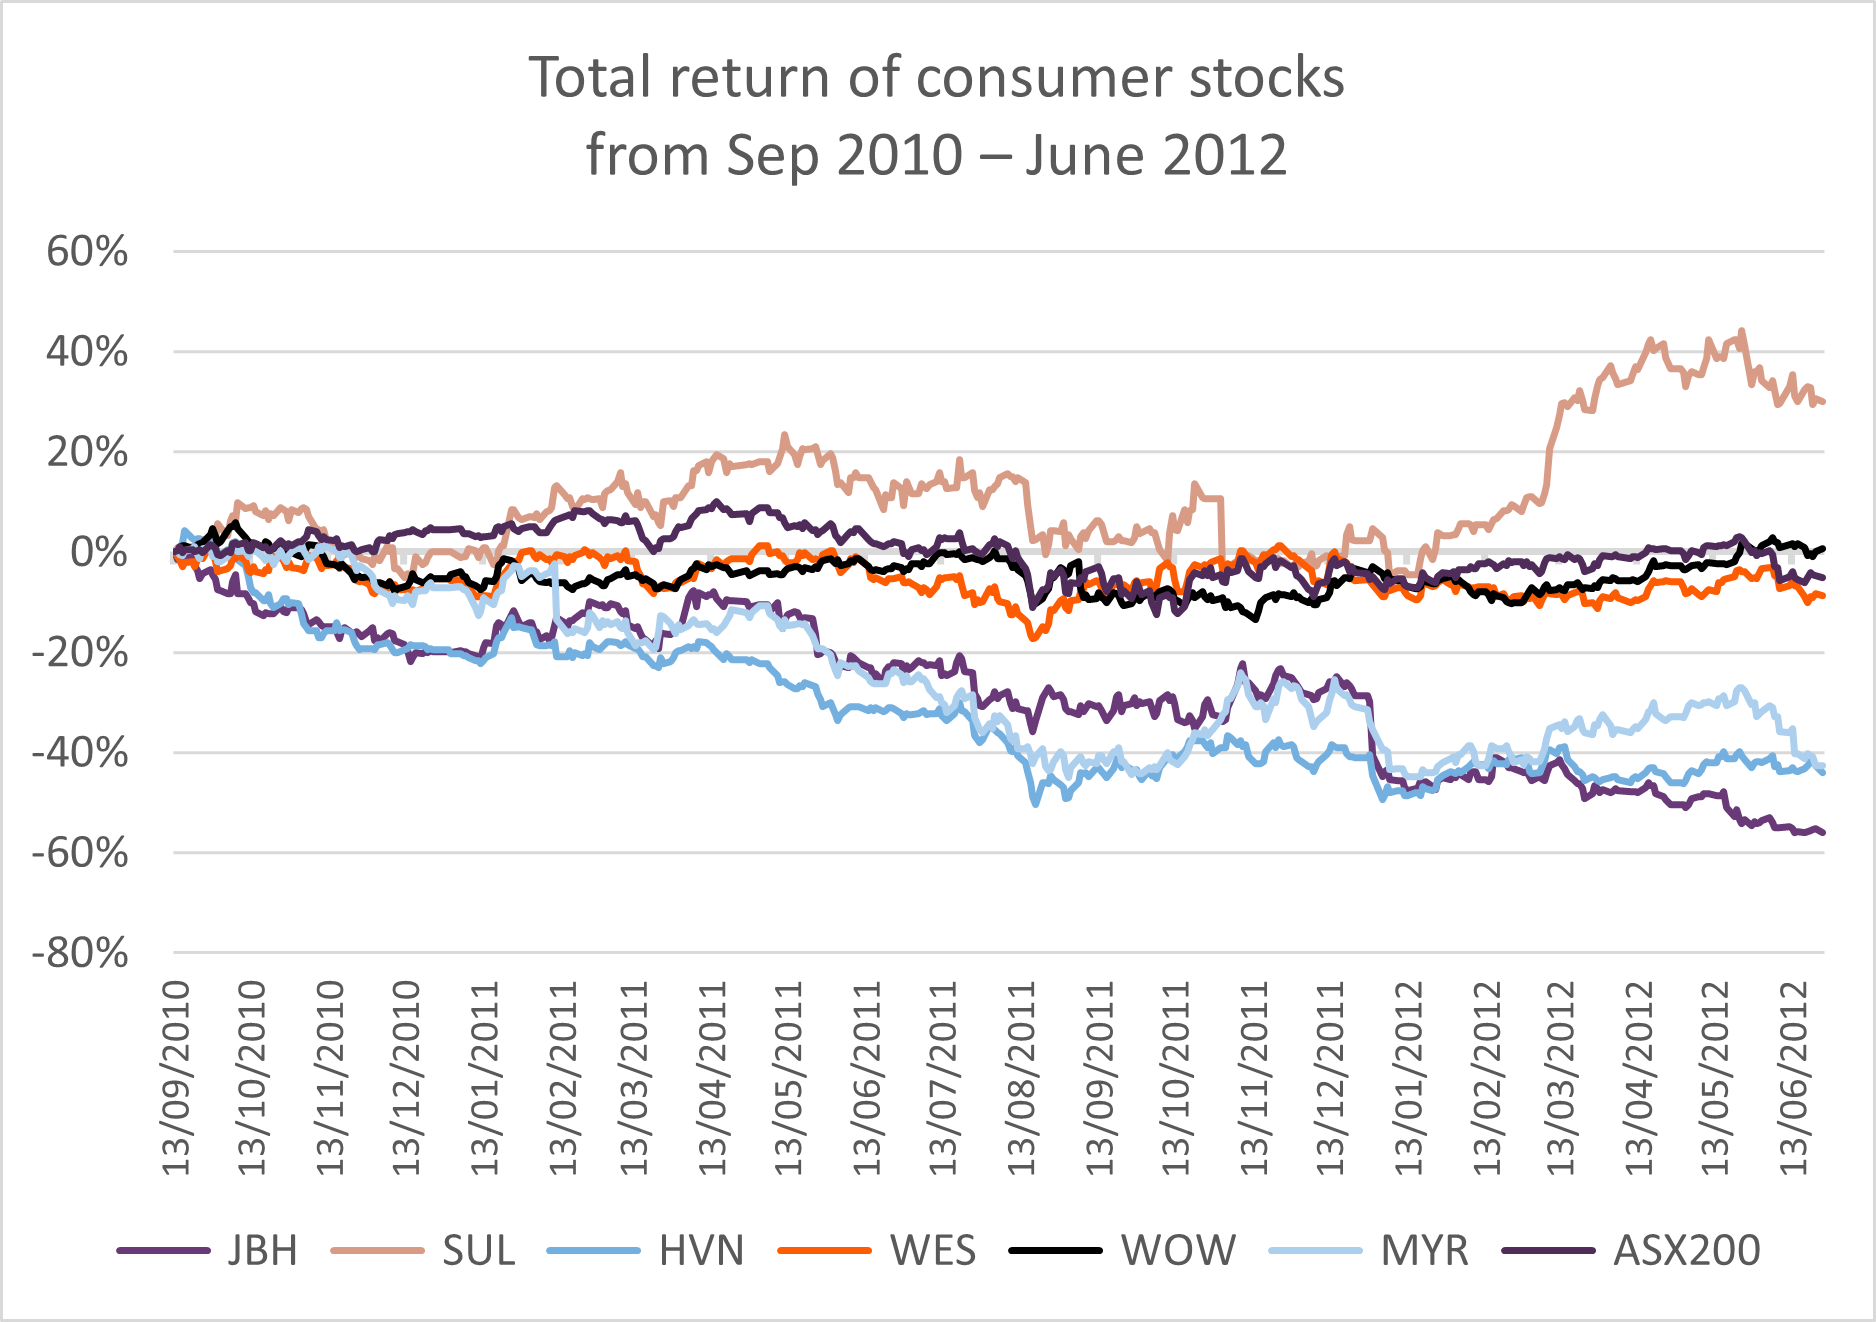
Source: IRESS, Touchstone Asset Management
Employment's impact on consumer spending
The key factor in determining the depth of the fall in consumer spending is employment. To date, consumer spending has actually been remarkably resilient. Households seem happy to keep spending in the face of significant increases in the cost of living. This is not unusual, and is largely explained by the fact consumers not only feel secure in their jobs, but are also enjoying large pay rises.
What would change the picture entirely is if and when unemployment starts to increase. Consensus expects the unemployment rate will move higher from the current 3.6%, reaching 4.2% by the end of 2023, and gradually increasing to 4.6% by the end of 2024 (we think that there is upside risk to this number). Wages growth should also peak in early 2024. However, there is a risk that wage rises may be stickier than expected due to Australia’s rigid wage setting mechanism.
Overall, the modest increase in unemployment would be consistent with continued softness in consumption into 2024, but not a collapse. Increasing immigration should also support retail volume growth.
Consensus earnings still too high
When Harvey Norman announced its recent earnings downgrade, there had already been 10 downgrades in the sector, and much industry commentary that Harvey Norman was losing market share. Despite this, their 2H23 earnings still came in 10% below consensus expectations. We believe that consensus earnings for the market over the next couple of years is similarly at least 10% too high, with the issue particularly notable in forecast margins for industrial companies. The chart below shows that earnings is 10% above trend. Given the rapid rise in interest rates and subsequent economic slowdown it would not be a surprise for earnings to fall below trend.
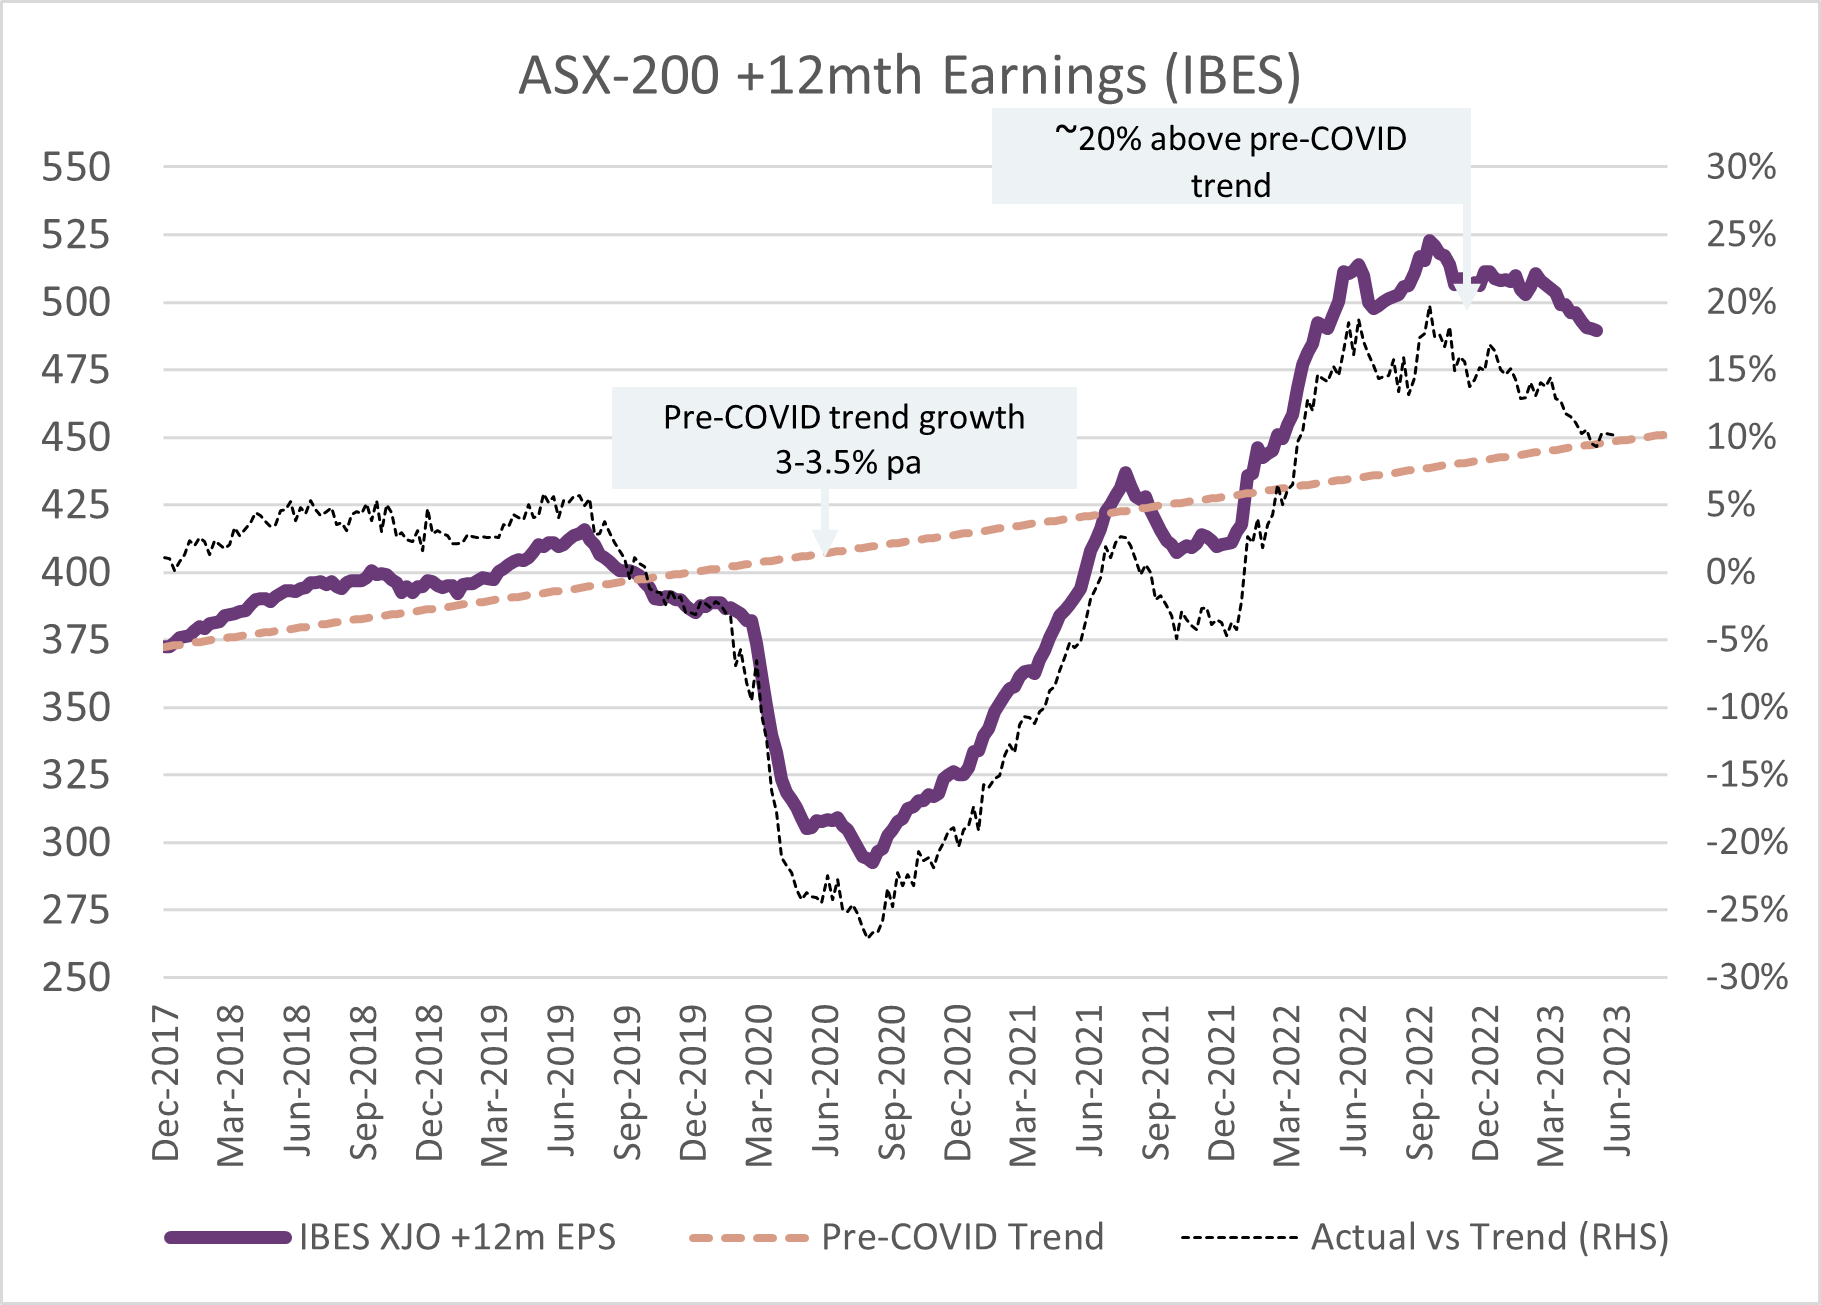
Source: Touchstone Asset Management, IBES
Within the consumer sector, the companies that benefited the most through COVID are now seeing earnings normalise, and industry feedback suggests household items, such as large appliances and furniture, were weak through May and June. Some of the more discretionary areas of household spending, like entertainment, recreation, eating out, and international travel, have been resilient. We expect they will start to weaken in the second half of this year. The lower demand will see discounting and promotional activity increase (it fell dramatically through the COVID period), which will pressure gross margins.
Many cost lines come through to corporate earnings with a lag, notably wages, energy and rent, which we expect will further pressure margins, as will operating deleverage. This may all seem quite obvious, but it’s still not sufficiently in consensus forecasts. Over the past six weeks, there have been around 10 downgrades from retailers, concentrated mostly in the small caps. On average these have delivered FY23 sales/NPAT downgrades of around -4%/-19% and -8%/-28% for FY24.[3]
Supporting our view that consensus is slow to react, Morgan Stanley published numbers on 25 June which showed the median age of broker estimates by stock[4]. Despite the fact that there had been many downgrades in the consumer sector over the past month, the median age of consensus forecast for the consumer stocks was around 50 days. It was notable that the median Harvey Norman forecast (prior to the earnings miss) was 89 days. This is a market wide issue. Morgan Stanley’s work showed half the constituents within the ASX 300 still have a median earnings age of above 50 days, with roughly 45 stocks having forecasts that have not been updated for 81-90 days.
So, what does that mean for the portfolio?
We are cognisant that many companies have stale consensus numbers, and there is scope for earnings misses in the upcoming August reporting season. We expect that outlook comments will also be cautious.
Households will face more challenging conditions over the next 3-6 months, as will companies with increasing costs. This pressure on households will likely broaden out to other sectors, such as the banks.
While we are clearly of the view that consumer spending will weaken, perhaps significantly, we are mindful that consumer stocks may start to recover well before the fundamentals improve. The conclusion, however, is that for most consumer stocks, better buying opportunities may lay ahead in the next 6-12 months.
[1] UBS Evidence Lab, 19 June 23
[2] Reserve Bank of Australia, April 2023 Financial Stability Review
[3] Source: company releases from ADH, TWE, UNI, BBN, DSK, BST, HVN, CCX, MHJ, MBH
[4] Morgan Stanley Research, Earnings Roll Over, 25 June 2023
The content contained in this article represents the opinions of the authors. The authors may hold either long or short positions in securities of various companies discussed in the article. This commentary in no way constitutes a solicitation of business or investment advice. It is intended solely as an avenue for the authors to express their personal views on investing and for the entertainment of the reader.